 An official website of the United States government


FY25 Enrollment Data from NIH-Supported Clinical Research Now Available
As part of NIH’s continued efforts to increase the transparency of the NIH research portfolio, data on the sex, race, ethnicity, and age of participants in fiscal year (FY) 2025 NIH-supported clinical research are now available. The FY25 data were presented at the 64th meeting of the Advisory Committee on Research on Women’s Health (ACRWH) on April 7, 2026. Data from previous years are available on the NIH Report Inclusion of Women and Minorities in Clinical Research page.
NIH is committed to ensuring that the research we support benefits all those affected by the condition under study. When clinical studies appropriately represent participants across sex, race, ethnicity, and age, the resulting evidence is stronger, more applicable, and better positioned to improve health outcomes for all.
- NIH’s inclusion policies, the Policy and Guidelines on the Inclusion of Women and Members of Racial and/or Ethnic Minority Groups in Clinical Research and the Inclusion Across the Lifespan Policy, require scientifically appropriate inclusion of women, members of racial and/or ethnic minority groups, and individuals of all ages in clinical research.
- The Policy on the Inclusion of Women and Members of Racial and/or Ethnic Minority Groups also requires analyses by sex, race, and/or ethnicity for NIH-defined Phase 3 clinical trials.
- Applicable NIH-defined Phase 3 clinical trials must report results of those analyses in ClinicalTrials.gov.
Each year, NIH-supported investigators and recipients provide deidentified individual-level data on participant sex, race, ethnicity, and age at enrollment in progress reports. The aggregate FY25 data are shown below.
FY25 Enrollment Overview
- NIH-funded clinical research enrolled a total of 11,048,927 participants worldwide: 8,202,424 participants enrolled at U.S. sites and 2,846,503 at non-U.S. sites.
- A total of 720,577 participants were enrolled in NIH-defined Phase 3 clinical trials.
Enrollment by Sex
- Women continue to be strongly represented in NIH-supported clinical research. In FY25, 57.8% of participants were female, 35.3% were male, and 7.0% were unknown or not reported (Figure 1).
- For all demographic categories, participants are listed as unknown/not reported when no reportable response was available for that demographic item. This may occur when the participant did not provide a response within the listed reporting categories or when the information was otherwise unavailable.
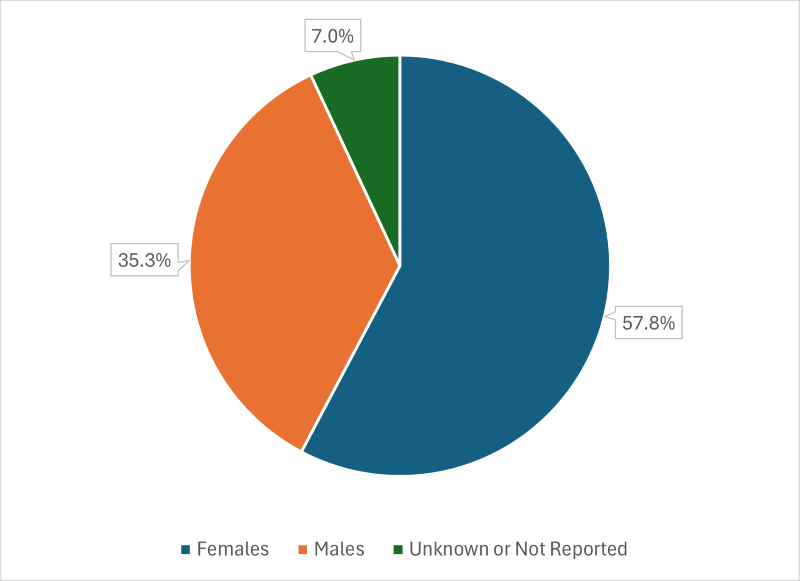
Figure 1: FY25 Enrollment in NIH-Funded Clinical Research by Sex
Enrollment by Race and Ethnicity
- In FY25, 33.6% of U.S. participants identified as members of racial and/or ethnic minority groups.
- The largest racial groups represented in U.S. clinical research were White (56.2% of participants) and Black or African American (14.0%) (Figure 2).
- Hispanic or Latino participants represented 12.6% of U.S. participants (Figure 3).
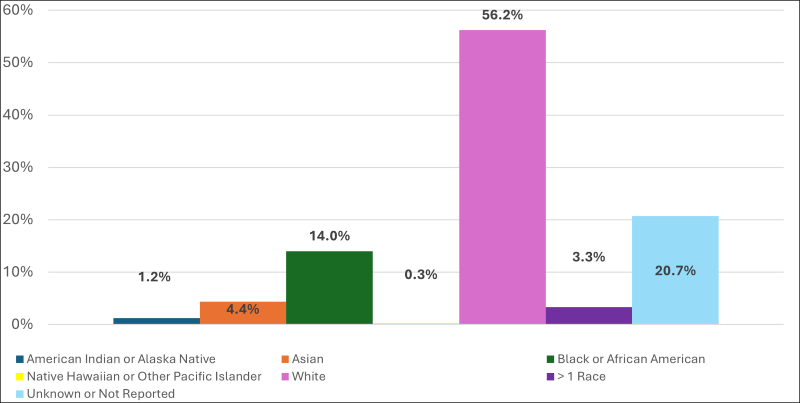
Figure 2: FY25 Enrollment in U.S. NIH-Funded Clinical Research by Race
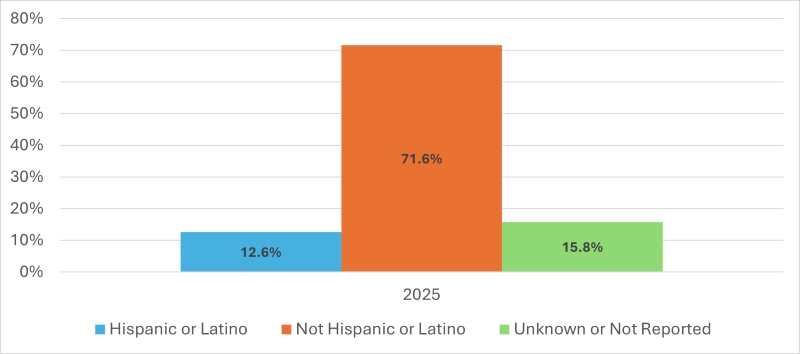
Figure 3: FY25 Enrollment in U.S. NIH-Funded Clinical Research by Ethnicity
Enrollment by Age
- Most participants in NIH research (57.2%) were adults 18-64 years of age. 17.2% of participants were children younger than 18 and about 17.6% were adults ages 65 and older. The remaining 8.1% were unknown or not reported (Figure 4).
- Figure 5 provides a more detailed breakdown by participant age group. The largest age groups represented are 26-34 years, 35-44 years, and 55-64 years, respectively.
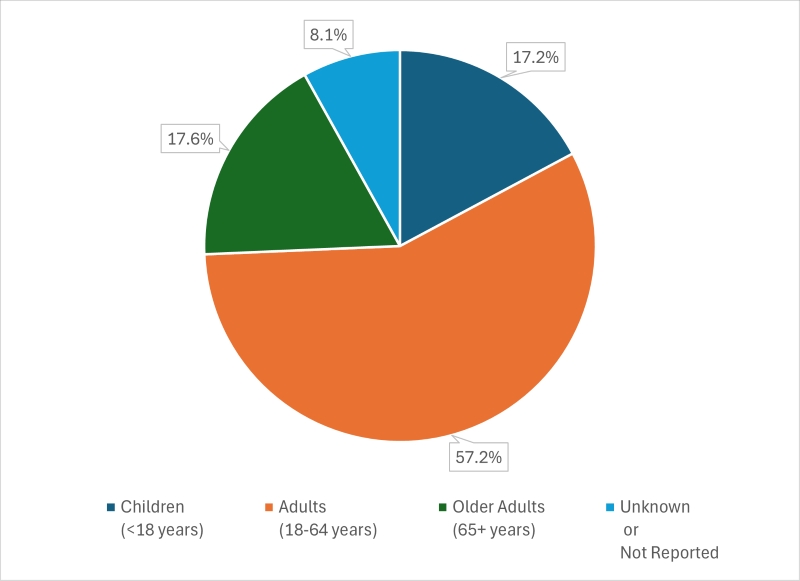
Figure 4: FY25 Enrollment in NIH-Clinical Research by Broad Age Groups
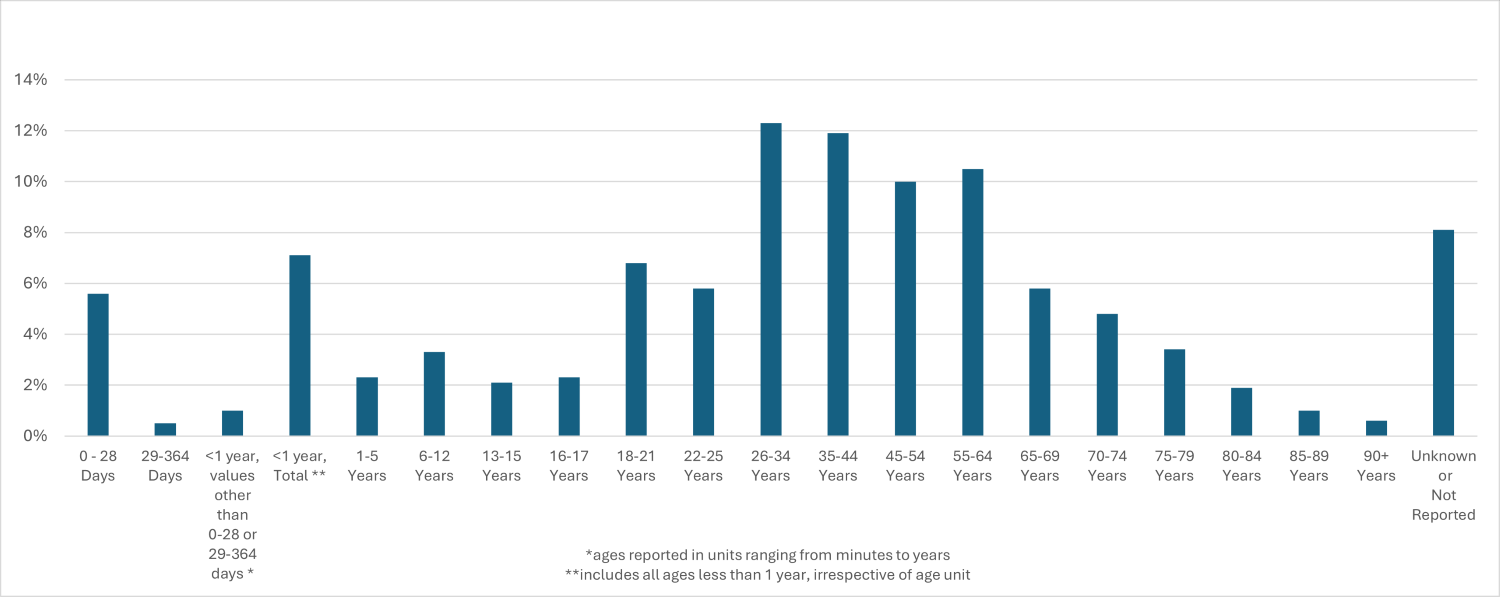
Figure 5: FY25 Enrollment in NIH-Clinical Research by Narrow Age Groups
Appropriate participant representation in NIH clinical research is fundamental to scientific excellence. Research with scientifically appropriate participant representation results in findings that are more reliable, more applicable, and more informative for clinical decision-making. NIH will continue to work with the research community to strengthen participant representation and ensure that the knowledge NIH research generates benefits all people affected by the condition under study.